Don't miss these travel and tourism statistics of India, which include everything from the industry market size to the most visited destinations.
India brims with countless cultural and natural attractions, making it one of the most vibrant travel destinations in the world.
From five-star hotels to the most delicious food and beautiful architecture, there’s a lot to discover in this South Asian country.
But did you know how many tourists visit India every year?
How many jobs does the Indian travel industry provide?
In this statistics round-up, we’ve summarized everything you’ve ever wanted to know about travel and tourism in India.
Let’s dive in!
Sources: You can find the source for every statistic listed at the end of this blog post.
Note: Some posts may contain affiliate links. Read more in our Privacy Policy. Learn more about how we create and update content in our Publishing Guidelines.
Which country visits India the most?
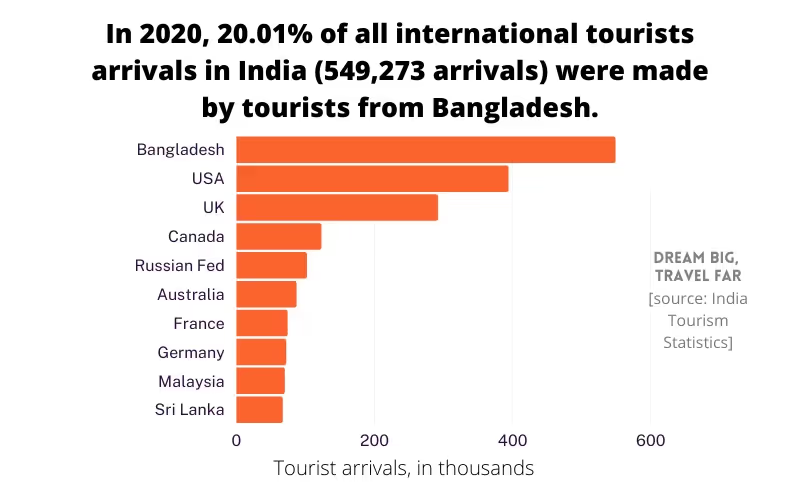
In 2020, 20.01% of all international tourists arrivals in India, or 549,273 arrivals, were by people from Bangladesh.
In 2021, the USA surpassed Bangladesh as the leading source of foreign tourists in India with 429 thousand arrivals.
How many tourists come to India every year?
In 2021, India recorded 7 million international tourists arrivals, down from about 17.9 million in 2019.
What is the total travel market in India?
The travel market in India was valued at 75 billion U.S. dollars in 2020 and is expected to hit 125 billion U.S. dollars by 2027.
Which is the No 1 tourist place in India?
The Taj Mahal in Agra is the most popular tourist destination in India, attracting both domestic and foreign visitors.
It was the most visited ticketed monument among domestic tourists in India, welcoming 3.29 million visitors in the period of 2021-2022.
What is the rating of India for tourism?
India sat on 54th place in the travel and tourism development index in 2021, a decline from 34 in 2019.
The first place went to Japan and second to the US.
The travel and tourism development index was based on enabling environment, policies, infrastructure, demand drivers, and sustainability.
Main India travel statistics
In 2021, India recorded 7 million international tourist arrivals, down from about 17.9 million in 2019.
The top 10 countries for foreign tourist arrivals to India in 2020 were Bangladesh, USA, UK, Canada, Russian Federation, Australia, France, Germany, Malaysia, and Sri Lanka.
In terms of region, the majority of international tourists in India is from South Asia, representing 27.33% of the total market in 2020.
In 2019, there were 2.32 billion domestic tourist visits in India, which unfortunately fell to 610 million in 2020.
In 2021, the Indian travel and tourism industry generated around US $178 billion to the country’s GDP.
The travel market in India was valued at 75 billion U.S. dollars in 2020 and is expected to hit 125 billion U.S. dollars by 2027.
The most popular protected monuments in Delhi are Red Fort (2.29 million visits in 2019) and Qutub Minar (2.3 million visits in 2019).
The Indian hotel market was valued at around 32 billion U.S. dollars in 2020 and expected to grow to 52 billion U.S. dollars by 2027.
The average daily rate (ADR) for a hotel room in India in Q1 2022 was 5,232 Indian rupees, a fall from 6,117 Indian rupees in Q1 2020 pre-pandemic.
India inbound travel statistics
1. In 2021, India recorded 7 million international tourist arrivals, down from about 17.9 million in 2019.
[Statista]
2. The port of entry in India with the most foreign tourist arrivals was Indira Gandhi International airport in Delhi, with more than 606 thousand arrivals in 2021.
[Statista]
This figure accounted for 45.3% of the foreign tourist arrivals in India in 2021.
3. Based on number of foreign tourist arrivals, in 2019, India was the 24th most visited country in the world.
[India Tourism Statistics]
4. Overall, in 2021, India ranks 54th in the travel and tourism development index, falling from its 34th place in 2019.
[Statista]
The index was based on enabling environment, policies, infrastructure, demand drivers, and sustainability.
Demographics of tourists in India
4. The top 10 countries for foreign tourist arrivals to India in 2020 were Bangladesh, USA, UK, Canada, Russian Federation, Australia, France, Germany, Malaysia, and Sri Lanka.
[India Tourism Statistics]
5. In 2020, 20.01% of all international tourists arrivals in India (549,273 arrivals) were made by tourists from Bangladesh.
[India Tourism Statistics]
Bangladesh and India share the fifth-longest land border in the world, which might explain the popularity of India for Bangladeshi travellers.
6. However, in 2021, the USA became the top source of foreign tourists in India with 429 thousand arrivals.
[Statista]
7. There were 394 thousand visitors arriving from the USA, which made up 14.36% of all foreign tourist arrivals in India in 2020.
8. In 2021, American arrivals in India rose again to 429 thousand, though it’s still well below the 2019 figure.
[Statista]
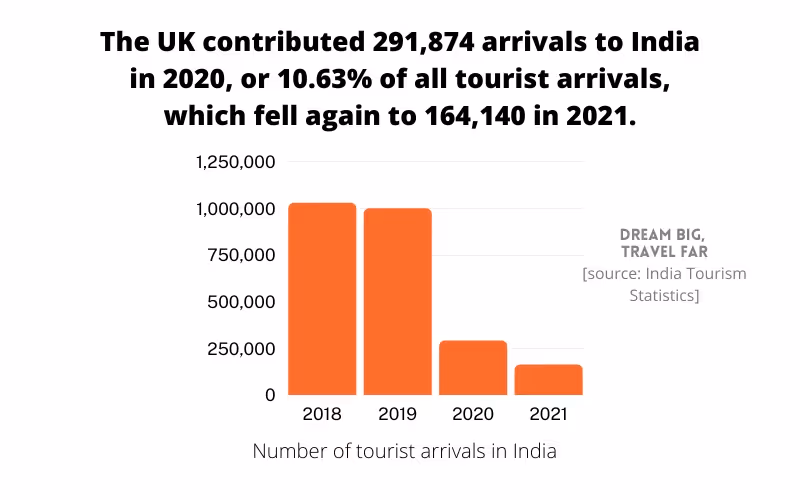
9. The UK contributed 291,874 arrivals to India in 2020, or 10.63% of all tourist arrivals, which fell again to 164,140 in 2021.
[India Tourism Statistics]
In 2020, the number of British tourists visiting in India fell to just 291 thousand because of the Covid-19 pandemic, from over 1 million in 2018 and 2019. This continued to decline to just over 164 thousand in 2021.
10. Sitting in 10th place, Sri Lankans made up 2.5% of all foreign tourist arrivals to India in 2020.
In 2021, Sri Lanka fell out of the top 10 rank of source markets for foreign tourist arrivals in India.
11. In terms of region, the majority of international tourists in India is from South Asia, representing 27.33% of the total market in 2020.
[India Tourism Statistics]
They’re followed by tourists from Western Europe (22.76%), North America (18.83%), South East Asia (8.44%), and East Asia (4.75%).
12. In 2020, the biggest age group of international visitors in India was 35-44 year olds (20.2%).
[India Tourism Statistics]
Meanwhile, 25-54 year olds make up more than half (58.3%) of all foreign visitors in India.
13. In 2020, 57.8% of international visitors in India were males.
[India Tourism Statistics]
42.4% of tourists arriving in India in 2020 were females. This ratio has become more evenly distributed compared to the percentage share in 2001, when only 24.5% of foreign tourists in India were females.
14. On the other hand, only 29.7% of all departure from India by Indian nationals were made by females, as opposed to 70.3% of males.
[India Tourism Statistics]
This figure is interesting as it shows that significantly fewer Indian females travel abroad.
Outbound & domestic tourism from India statistics
What is the size of outbound travel market in India?
15. In 2019, there were 2.32 billion domestic tourist visits in India, which unfortunately fell to 610 million in 2020.
[India Tourism Statistics]
16. Domestic spending contributed 94% of all tourism revenues to India in 2021, up from 82% in 2019.
[Statista]
17. Domestic visitor spending across India in 2021 was at 151 billion U.S. dollars. This put India in fourth place worldwide in terms of domestic tourism expenditure.
[Statista]
18. In 2021, the state of Tamil Nadu had the largest share of domestic tourist visits (17% of total, or 115 million tourist visits).
[Statista]
19. The number of Indian nationals’ departures from India during 1991 was 1.94 million, which grew to 26.9 million in 2019 (and fell again to 7.29 million in 2020).
[India Tourism Statistics]
20. In 2020, the most visited country by Indian nationals was UAE, with 2,974,002 departures.
[India Tourism Statistics]
Indian tourism industry statistics
How big is the tourism industry in India?
21. In 2021, the Indian travel and tourism industry generated around US $178 billion to the country’s GDP.
[Statista]
The figure has yet to reach its all-time high of US $247 billion in 2018.
22. Meanwhile, the government in India spent a total of $2.61 billion across the tourism sector in 2017. It’s forecast to reach $5.65 billion in 2028.
[Statista]
23. The total domestic visitor spending in India in 2021 was US $151 billion.
[Statista]
24. The travel market in India was valued at 75 billion U.S. dollars in 2020 and is expected to hit 125 billion U.S. dollars by 2027.
[Statista]
Hotels and airlines made up the majority of the Indian travel market.
25. The travel and tourism industry in India provided almost 80 million jobs in 2020, or 15.3% of all jobs overall.
[Statista]
Tourist destinations in India
26. The most popular ticketed monument among in India for domestic tourists in 2021-22 was the Taj Mahal, with 3.29 million visitors that year.
27. The top five states for domestic tourists in India in 2020 were Tamil Nadu (140.7 million), Uttar Pradesh (86.1 million), Karnataka (77.5 million), Andhra Pradesh (70.8 million), and Telengana (40 million).
[India Tourism Statistics]
28. The most popular protected monuments in Delhi are Red Fort (2.29 million visits in 2019) and Qutub Minar (2.3 million visits in 2019).
[India Tourism Statistics]
As the capital city, Delhi is very popular among foreign and domestic tourists. It has lots of interesting places to visits, including Red Fort and Qutub Minar.
29. Meanwhile, Chittaurgarh Fort is the most visited protected monument in Jodhpur, with 580,321 visits in 2019.
34. The share of business travel revenues in India compared to leisure spending has been slowly declining, from 21.1% in 2013 to just 4% in 2021.
[Statista]
35. As of June 2022, there are 211 government recognized tour operators in India.
[Statista]
36. In 2020, the travel agent market in India was worth 38 billion U.S. dollars. 35% of bookings made through travel agents were for airlines, while another 35% were for hotels.
[Statista]
37. Travel apps are huge in India, with downloads growing by 38% CAGR since 2019. In Q4 2022, there were almost 66 million app downloads in the transportation category.
[Statista]
Accommodation in India statistics
How big is the Indian hospitality industry?
38. The Indian hotel market was valued at around 32 billion U.S. dollars in 2020 and expected to grow to 52 billion U.S. dollars by 2027.
[Statista]
The hotel market in India is a booming industry, valued at US$ 32 billion in 2020 and forecast to reach US$ 52 billion in 2027.
39. In 2020, domestic travel made up 80% of the hotel market in India.
[Statista]
40. As of 2023, the occupancy rate of hotels in India was 68%, an increase from 34% in 2021.
[Statista]
The hotel industry in India is recovering in 2023, reaching a 68% occupancy rate after dipping to 34% in 2021.
41. There were more than 152 thousand hotel rooms in India in 2022, which is expected to reach 200 thousand by 2027.
The leading cities with the highest number of hotel rooms in India are Bengaluru, New Delhi, and Mumbai.
As one of the most popular cities in India with plenty of things to do, it’s no wonder that Mumbai sits among the top three.
42. As of March 2022, the Indian Hotels Company Limited (IHCL) was the leading Indian hotel or restaurant company, with a market capitalization of 318 billion Indian rupees.
[Statista]
IHCL is known for its Taj hotels.
IHCL was followed by EIH and Sapphire foods, with 99.4 and 88.9 billion Indian rupees of market cap respectively.
43. The average daily rate (ADR) for a hotel room in India in Q1 2022 was 5,232 Indian rupees, a fall from 6,117 Indian rupees in Q1 2020 pre-pandemic.
[Statista]
When the pandemic hit and restrictions took place in March 2020, the ADR for hotel rooms in India declined to 3,365 Indian rupees.
44. In 2022, the city with the most hotel rooms was New Delhi, with more than 15 thousand hotel rooms in total.
[Statista]
It’s followed by Bengaluru and Mumbai.
45. In total, there were 153 thousand hotel rooms across India in 2022.
[Statista]
46. Airbnb India made a total of 687 million Indian rupees in revenue in 2020, a significant increase from 2018 and 2019 despite the second half of the year being impacted by the pandemic.
47.Travel by ‘air’ is the most preferred mode of transport. In 2020, 79.2% of foreign tourists arriving in India did so by air, followed by land (19.3%) and sea (1.5%).
[India Tourism Statistics]
The respective figures for 2019 were 77.4%, 21.7% and 0.9%.
48. In 2023, passenger traffic in Indian airports amounted to over 327 million, 56.9 million of which were international passengers.
[Statista]
49. Meanwhile, the number of domestic passenger arrivals in airports across India in 2023 was over 270 million.
[Statista]
50. The leading Indian passenger carrier airline was IndiGo, which had a 55% market share in 2022.
[Statista]
IndiGo was followed by SpiceJet, with a 13% market share.
51. Airasia has the sixth largest domestic market share (5.7%) of passenger airlines in 2022.
[Statista]
Summary
Overall, India is a beautiful country everyone should visit at least once in their lives.
We hope these statistics have helped you understand more about travel and tourism in India.
Disclaimer: Fully research your destination prior to travel, or any products prior to purchase. We can accept no responsibility for anything you experience as a result of the information found on this website. Some posts may contain affiliate links, which means we receive a small commission for some purchases, at no additional expense to you. Read more in our privacy policy here.
As the type 1 diabetic half of Dream Big, Travel Far, I'm passionate about encouraging fellow type 1's to travel the world and not let their diabetes hold them back. I'm proud to now be a full-time digital nomad. Meaning I live my life working and travelling all over the world and am here to help you achieve your dreams as well in any way I can.


Leave a comment
Let us know what you think!